
Infographics
Infographics a way to visualize data.
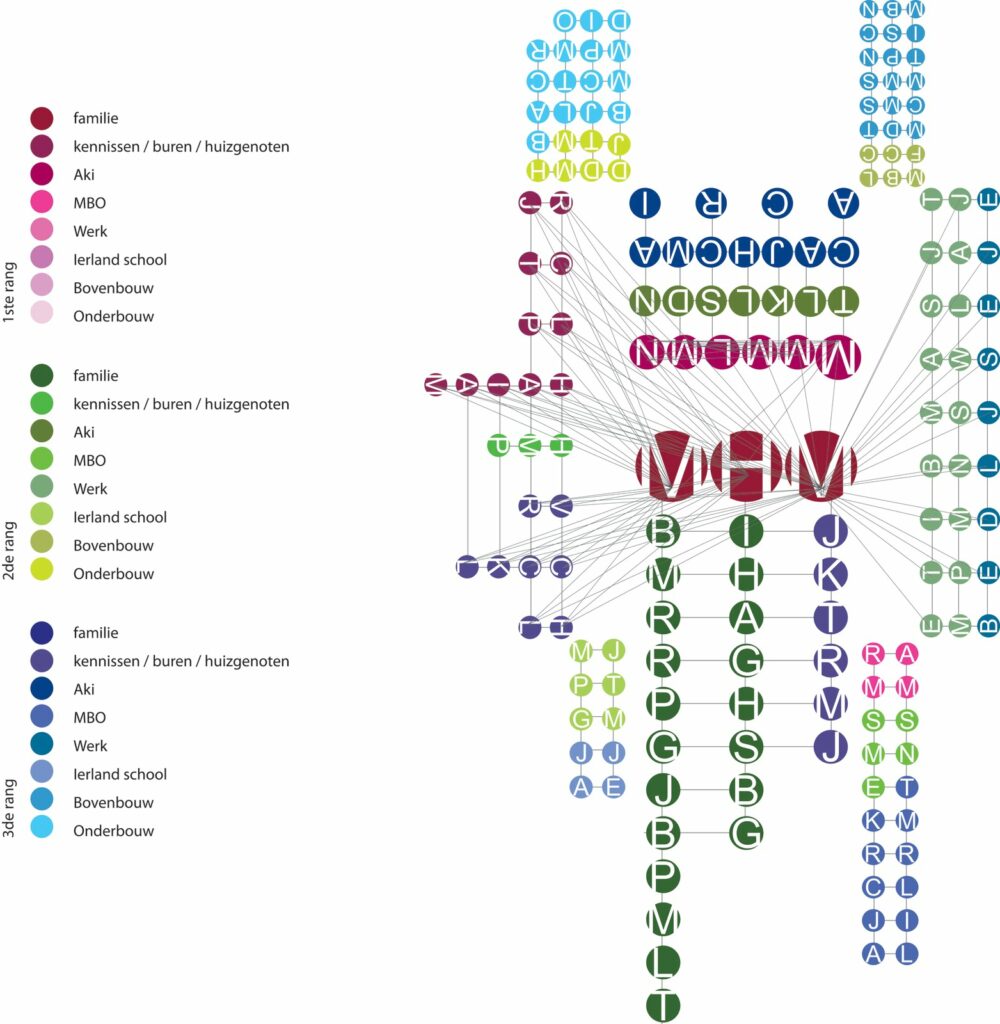
The one on the left: “Friends and Acquaintances” how close are people to me and their connections to one another.
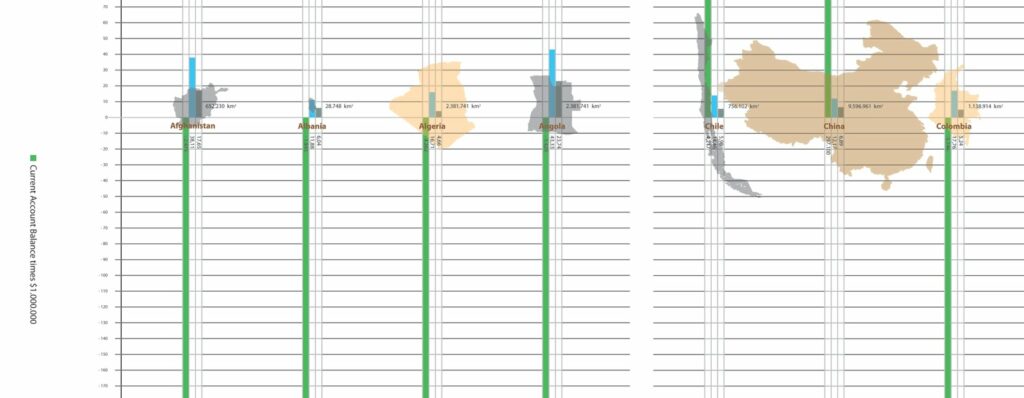
On the Right a fragment of a much larger infographic around death rates, births and population.